cAdvisor: (Container Advisor) provides container users an understanding of the resource usage and performance characteristics of their running containers.
Prometheus: An open-source monitoring system with a dimensional data model, flexible query language, efficient time-series database, and modern alerting approach.
Grafana is multi-platform open-source analytics and interactive visualization web application.
Prometheus configuration with yml file
First, you’ll need to configure Prometheus to scrape metrics from cAdvisor. Create a prometheus.yml file and populate it with this configuration:
scrape_configs:
- job_name: cadvisor
  scrape_interval: 5s
  static_configs:
  - targets:
    - cadvisor:8080
Docker Compose configuration
Now we’ll need to create a Docker Compose configuration that specifies which containers are part of our installation as well as which ports are exposed by each container, which volumes are used, and so on.
In the same folder where you created the prometheus.yml file, create a docker-compose.yml file and populate it with this Docker Compose configuration:
version: '3.2'
services:
  prometheus:
    image: prom/prometheus:latest
    container_name: prometheus
    ports:
    - 9090:9090
    command:
    - --config.file=/etc/prometheus/prometheus.yml
    volumes:
    - ./prometheus.yml:/etc/prometheus/prometheus.yml:ro
    depends_on:
    - cadvisor
  cadvisor:
    image: gcr.io/google-containers/cadvisor:latest
    container_name: cadvisor
    ports:
    - 8080:8080
    volumes:
    - /:/rootfs:ro
    - /var/run:/var/run:rw
    - /sys:/sys:ro
    - /var/lib/docker/:/var/lib/docker:ro
    depends_on:
    - redis
  grafana:
    container_name: grafana
    image: grafana/grafana:5.1.0
    ports:
      - 3000:3000

  redis:
    image: redis:latest
    container_name: redis
    ports:
    - 6379:6379
$ docker-compose upThis configuration instructs Docker Compose to run three services, each of which corresponds to a Docker container:
- The
prometheusservice uses the localprometheus.ymlconfiguration file (imported into the container by thevolumesparameter). - The
cadvisorservice exposes port 8080 (the default port for cAdvisor metrics) and relies on a variety of local volumes (/,/var/run, etc.). - The
redisservice is a standard Redis server. cAdvisor will gather container metrics from this container automatically, i.e. without any further configuration.
Exploring the cAdvisor web UI
You can access the cAdvisor web UI at http://localhost:8080. You can explore stats and graphs for specific Docker containers in our installation at http://localhost:8080/docker/<container>. Metrics for the Redis container, for example, can be accessed at http://localhost:8080/docker/redis, Prometheus at http://localhost:8080/docker/prometheus, and so on.
Exploring metrics in the expression browser
cAdvisor’s web UI is a useful interface for exploring the kinds of things that cAdvisor monitors, but it doesn’t provide an interface for exploring container metrics. For that we’ll need the Prometheus expression browser, which is available at http://localhost:9090/graph. You can enter Prometheus expressions into the expression bar, which looks like this:
For checking configuration on prometheus, we should follow the path: status → Targets

Let’s start by exploring the container_start_time_seconds metric, which records the start time of containers (in seconds). You can select for specific containers by name using the name="<container_name>" expression. The container name corresponds to the container_name parameter in the Docker Compose configuration. The container_start_time_seconds{name="redis"} expression, for example, shows the start time for the redis container.NOTE: A full listing of cAdvisor-gathered container metrics exposed to Prometheus can be found in the cAdvisor documentation.
Other expressions
The table below lists some other example expressions
| Expression | Description | For |
|---|---|---|
rate(container_cpu_usage_seconds_total{name="redis"}[1m]) | The cgroup‘s CPU usage in the last minute | The redis container |
container_memory_usage_bytes{name="redis"} | The cgroup’s total memory usage (in bytes) | The redis container |
rate(container_network_transmit_bytes_total[1m]) | Bytes transmitted over the network by the container per second in the last minute | All containers |
rate(container_network_receive_bytes_total[1m]) | Bytes received over the network by the container per second in the last minute | All containers |
Grafana supports querying Prometheus. The Grafana data source for Prometheus is included since Grafana 2.5.0 (2015-10-28).
By default, Grafana will be listening on http://localhost:3000. The default login is “admin” / “admin”.
Reset Password
$ grafana-cli admin reset-admin-password newAdminPasswordCreating a Prometheus data source (Grafana)
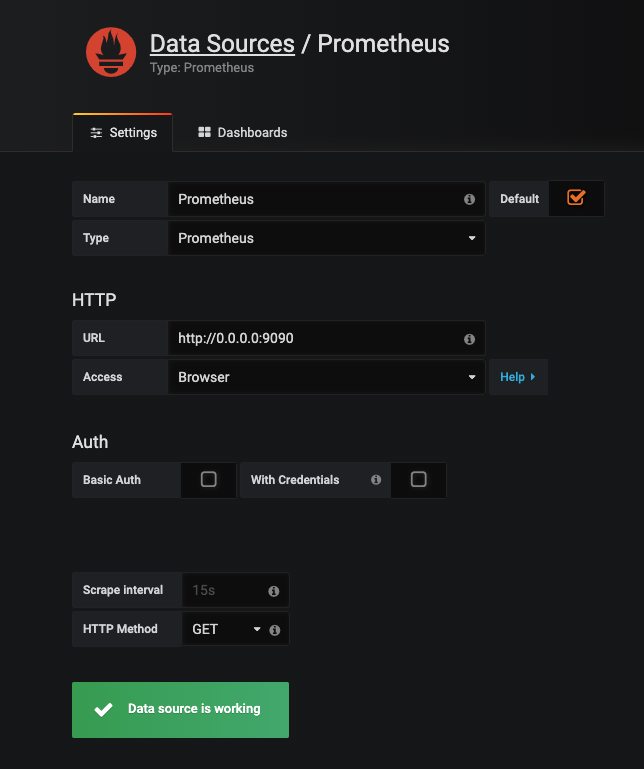
To create a Prometheus data source in Grafana:
By default, Grafana will be listening on http://localhost:3000. The default login is “admin” / “admin”.
Creating a Prometheus data source
To create a Prometheus data source in Grafana:
- Click on the “cogwheel” in the sidebar to open the Configuration menu.
- Click on “Data Sources”.
- Click on “Add data source”.
- Select “Prometheus” as the type.
- Set the appropriate Prometheus server URL (for example,
http://localhost:9090/) - Adjust other data source settings as desired (for example, choosing the right Access method).
- Click “Save & Test” to save the new data source.

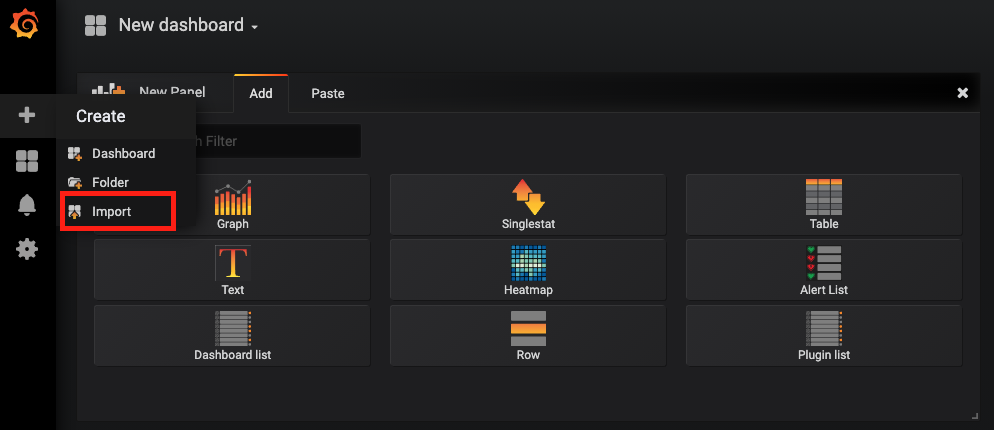
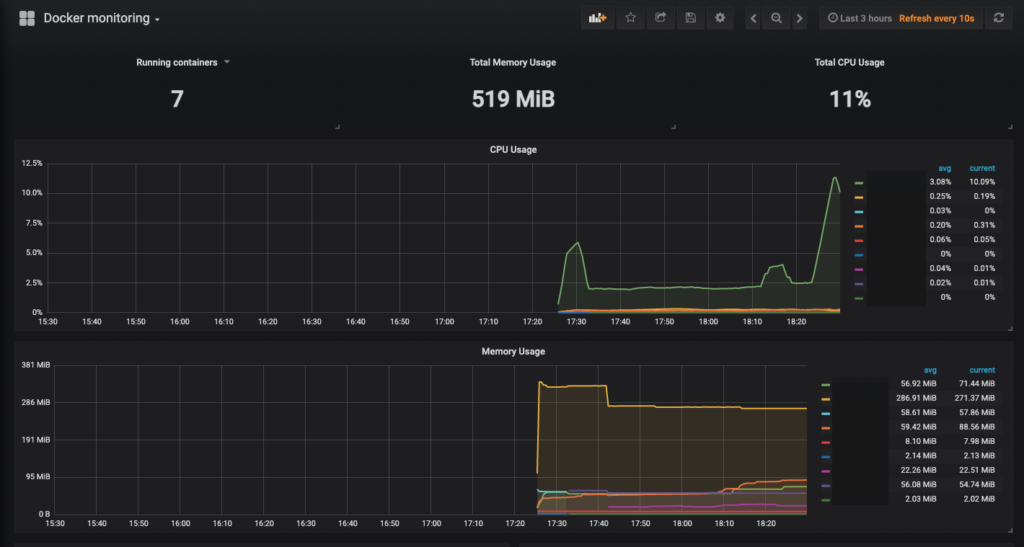
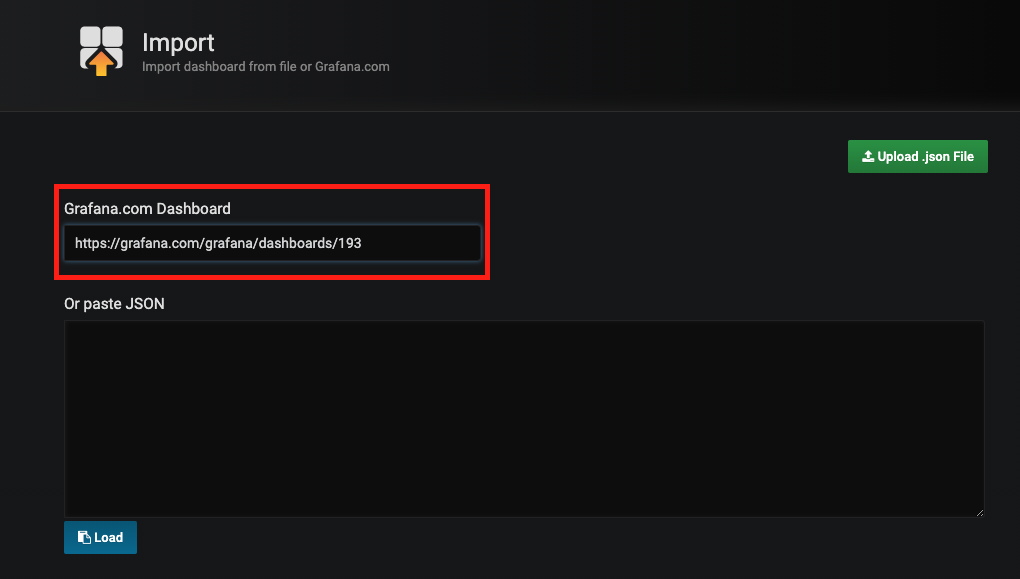
Search docker monitoring for Prometheus data source. This page has so many docker monitoring dashboards


